Zoomies Forex & Crypto
How to Trade on MT5:

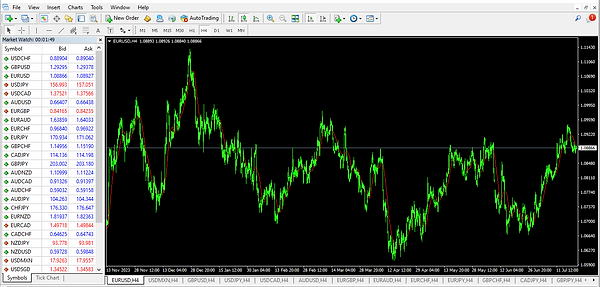
When it comes to trading charts, most brokerages use a third-party platform called MT5. The platform typically displays a variety of currency pairs, gold, cryptocurrencies, and crude oil on the left-hand side. Additionally, traders can log in to their accounts and customize their charts by changing the images. It's important to note that these charts are essential tools for traders to analyze market trends and make informed decisions.

To execute a trade, you can simply right-click on the chart and a small list will appear. From there, select 'one-click trading' or a similar option. This feature allows you to quickly and easily enter exit trades with just one click. It's a great tool for traders who want to streamline their trading process and make faster decisions. On the next image below will show on the top left corner on what 'one click trading' will look like. Once you click on 'one click trading', buttons will appear as shown below.

To make a trade, you can simply click on the "Buy" or "Sell" button as shown in the image. These buttons are located in the trading section of the website. Clicking on the "Buy" button will allow you to purchase, while clicking on the "Sell" button will enable you to sell. It's that simple!

When trading, it's important to set a stop loss and target profit to manage your risk and maximize your gains. The top red line represents your stop loss, which is the price level at which your trade will automatically close to prevent further losses. The bottom red line represents your target profit, which is the price level at which trade will automatically close to secure your profits. Remember, stop loss is used to limit your losses, while target profit used to take profits. By setting these levels, you can trade with confidence and minimize your risk. To set your stop loss, simply scroll up (or down depending if you're buying or selling) from where the trade was made. The line will appear green (or which ever color the broker has) once the trade is made. To set the target profit, simply follow the same steps. If you're buying, scroll up. If you're selling, scroll down to set the target profit.

When you take a look at the chart, you will also be able to view your account balance. This section will show you the margin levels, which indicate how close you are to making a profit or loss. It's important to keep an eye on this section to stay about your account's status.

In this video we are going to show how to execute a trade using MT5. The example we are going to be using is the USD/JPY pair. You can also trade cryptocurrencies, metals, or crude oil depending on the broker. it's important to understand the basics of the platform. You will need to open an account with a broker that offers MT5.

PIP or Percentage in Point, is a unit of measurement used in trading to indicate the change in value of a currency pair. It is typically used to measure the difference between the buy and sell price of a currency, and is often used to calculate profits or losses. For example, if you bought a currency pair at 1.2000 and sold it at 1.2020, you would have made a profit of 20 pips. Similarly, if you set a stop loss at 1.1980, you would have a stop loss of 20 pips.

In this video, you'll learn how to adjust the lot or increase the amount of money you want to trade. By increasing the lot size, you'll be able to trade more. This can be a strategy for traders who want to take advantage of market opportunities and potentially increase their profits.

In this video, you'll learn about the various time frames are available on charts. You'll see how the candlesticks have been placed on the charts and how they represent different time periods. By the end of the video, you'll have a better understanding of how to read and interpret with different time frames.

In this video, you will learn about the various options available to customize your charts. You can add indicators, modify chart patterns, adjust the time frame, and log in to your account, among other things. By end of this tutorial you will have a better understanding of how to personalize your charts to suit your trading needs.